Ở bài trước chúng ta đã lấy được đối tượng dạng JSON bằng các request. Bài này chúng ta sẽ hiển thị Highlight đối tượng đó .
Đối tượng chúng ta request được ở bài trước được lưu theo chuẩn GeoJSON, là một chuẩn mở dựa trên JSON để chia sẻ qua mạng một cách nhanh chóng và gọn nhẹ nhất. Các bạn có thể đọc thêm về chuẩn này tại đây: http://geojson.org/geojson-spec.html
Để Highlight đối tượng thực chất chúng ta sẽ add thêm 1 feature lên bản đồ của chúng ta để có thể tùy chỉnh style cho đối tượng. Chúng ta sẽ sử dụng loại đối tượng của OpenLayer là ol.layer.Vector.
Chúng ta thêm style mới cho đối tượng Highlight và layer vector như sau:
var styles = {'MultiPolygon': new ol.style.Style({stroke: new ol.style.Stroke({color: 'yellow',width: 1})})};var styleFunction = function (feature) {return styles[feature.getGeometry().getType()];};var vectorLayer = new ol.layer.Vector({style: styleFunction});map.addLayer(vectorLayer);
Các bạn lưu ý thêm code ngay sau đoạn code khởi tạo map. Đối tượng của mình là MultiPolygon nên mình sẽ để style như trên. Đối với những kiểu đối tượng khác thì các bạn sẽ phải sử dụng các kiểu style khác. Bài này mình dựa vào ví dụ của OpenLayer, các bạn có thể tham khảo để biết thêm: http://openlayers.org/en/v3.15.1/examples/geojson.html?q=style
Thêm đoạn code sau vào đoạn code hiển thị thông tin đối tượng tìm kiếm ở bài trước
var vectorSource = new ol.source.Vector({features: (new ol.format.GeoJSON()).readFeatures(n)});vectorLayer.setSource(vectorSource);
các bạn thêm ngay sau đoạn code $(“#info”).html(content);
new ol.format.GeoJSON()).readFeatures(n): Các bạn để ý n ở đây là biến data trả về sau request từ JQuery. Toàn bộ biến n này đã theo chuẩn GeoJSON nên chúng ta có thể đưa ngay vào đối tượng GeoJSON của OpenLayer. Tiếp theo là đưa vào source của layer vector chúng ta tạo ở trên.
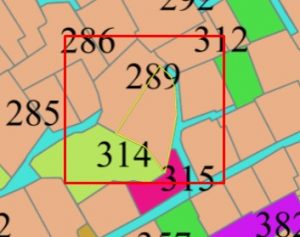
Kết quả như hình dưới
Sau đây là Code của cả bài, mình có chỉnh sửa lại một chút html cho dễ nhìn.
<head ><title>Openlayers test</title><style>.map, .righ-panel {height: 500px;width: 40%;float: left;}.map {border: 1px solid #000;}</style><script type="text/javascript">var ThuaDat;$("#document").ready(function () {var format = 'image/png';var bounds = [592435.5625, 2286018.5,593105.1875, 2286636];ThuaDat = new ol.layer.Image({source: new ol.source.ImageWMS({ratio: 1,params: {'FORMAT': format,'VERSION': '1.1.1',STYLES: '',LAYERS: 'dc:TD_12646',}})});var projection = new ol.proj.Projection({code: 'EPSG:3405',units: 'm',axisOrientation: 'neu'});var view = new ol.View({projection: projection});var map = new ol.Map({target: 'map',layers: [ThuaDat],view: view});var styles = {'MultiPolygon': new ol.style.Style({stroke: new ol.style.Stroke({color: 'yellow',width: 1})})};var styleFunction = function (feature) {return styles[feature.getGeometry().getType()];};var vectorLayer = new ol.layer.Vector({//source: vectorSource,style: styleFunction});map.addLayer(vectorLayer);//map.getView().fitExtent(bounds, map.getSize());map.getView().fit(bounds, map.getSize());$("#chkThuaDat").change(function () {if ($("#chkThuaDat").is(":checked")) {ThuaDat.setVisible(true);}else {ThuaDat.setVisible(false);}});map.on('singleclick', function (evt) {document.getElementById('info').innerHTML = "Loading... please wait...";var view = map.getView();var viewResolution = view.getResolution();var source = ThuaDat.getSource();var url = source.getGetFeatureInfoUrl(evt.coordinate, viewResolution, view.getProjection(),{ 'INFO_FORMAT': 'application/json', 'FEATURE_COUNT': 50 });if (url) {$.ajax({type: "POST",url: url,contentType: "application/json; charset=utf-8",dataType: 'json',success: function (n) {var content = "<table>";for (var i = 0; i < n.features.length; i++) {var feature = n.features[i];var featureAttr = feature.properties;content += "<tr><td>Số thửa:" + featureAttr["shthua"]+ "</td><td>Số tờ bản đồ:" + featureAttr["shbando"]+ "</td><td>Diện tích:" + featureAttr["dientich"]+ "</td><td>Loại đất:" + featureAttr["kh2003"]+ "</td></tr>"}content += "</table>";$("#info").html(content);var vectorSource = new ol.source.Vector({features: (new ol.format.GeoJSON()).readFeatures(n)});vectorLayer.setSource(vectorSource);}});}});});</script></head><body><div id="map" class="map"></div><div class="righ-panel"><input type="checkbox" id="chkThuaDat" checked /><label for="chkThuaDat">Thửa đất</label><img src="http://localhost:8080/geoserver/wms?REQUEST=GetLegendGraphic&VERSION=1.0.0&FORMAT=image/png&LAYER=dc:TD_12646" /><div id="info"></div></div></body></html>Hẹn các bạn ở bài 8- hiển thị Popup khi kick vào đối tượng.
Tác giả: Đỗ Xuân Cường
Nguồn bài viết: cuongdx313.wordpress.com









![[Học WebGIS nâng cao] – Bài toán tìm đường với PostGIS+ pgRouting](https://ungdungmoi.edu.vn/wp-content/uploads/2018/09/hoc-webgis-nang-cao-1-218x150.jpg)
